RGB: A brief introduction to data sonification as compositional process
https://www.youtube.com/embed/qyDVJk5ovaw
'RGB' by Thomas Metcalf (b. 1996), performed by Thomas Carr (clarinet) and David Palmer (piano).
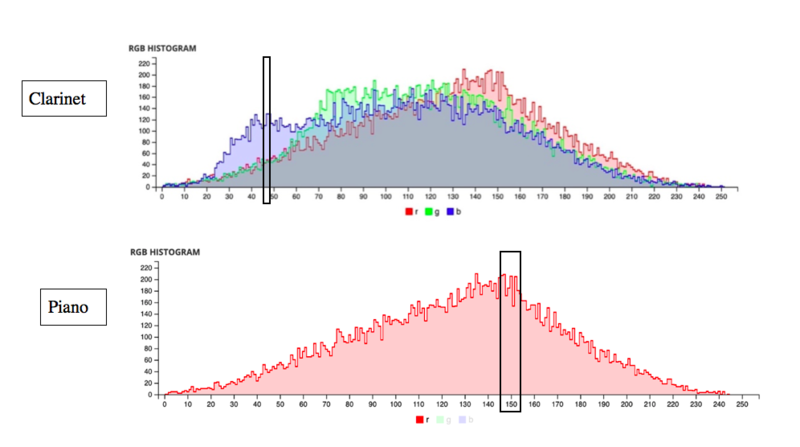
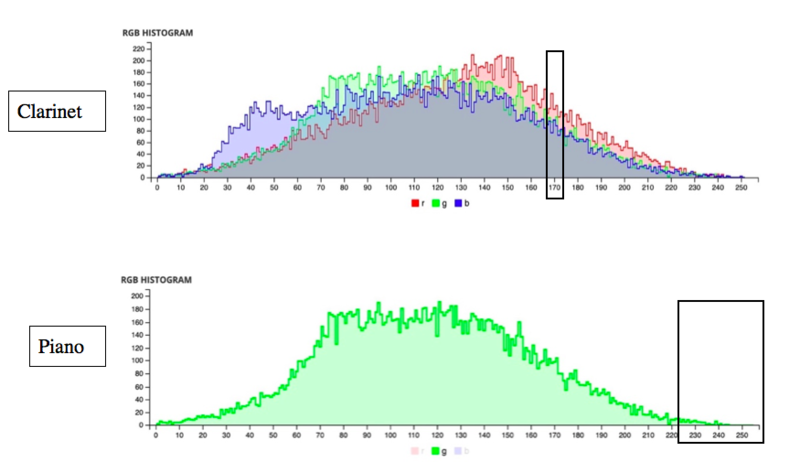
The technical idea that inspired my piece, RGB, was that of using multiple data graphs as a means of creating a musical composition. To generate these data graphs, I used a computer programme that analysed the RGB (red–green–blue) content of Jackson Pollock’s Out of the Web (1949). (1) In this way, I hoped to create an alternate reading of the painting that uses the underlying, or non–immediate, qualities as a fundamental compositional tool. (2) Therefore, the piece is not intended to match the visceral visual representation of the painting. One might view this as a computer’s view of the painting in its fundamental colour structure. The graphs generated from the analysis can be seen below:
Process
The process of composing this piece is an example of data sonification. In his ‘Introduction to Data Sonification’, David Worrall cites key definitions of data sonification, which centre on the idea of creating ‘mappings’ of data (inputs) to sound (outputs). Taking a less complex form of data sonification, we can use Carla Scaletti’s definition as a starting point for applications to composition:
a mapping of numerically represented relations in some domain under study in relation to an acoustic domain for the purposes of interpreting, understanding, or communicating relations in the domain under study. (3)
The use of four graphs as an input, which are generated from a singular source and then reduced to numbers to convey the ‘saturation’ of colour at any given point, provides a useful example of the concept of data sonification. (4)
The overall form of the piece consists of the constituent colours (R, G, B) played alongside the ‘true’ colour (RGB) of the painting to create a dual structure as follows:

The RGB material is played by the clarinet, whilst the filtered colours are played by the piano. It is worth noting that any position on the RGB graph is, therefore, worth three times that of any of the positions on the filtered graphs (to reflect this 1:3 ratio), which also helps to create the impression of reading data at different speeds.
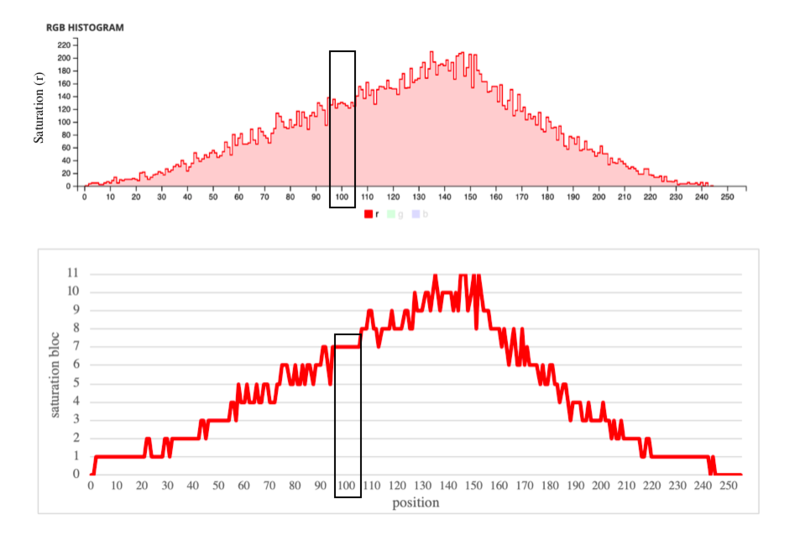
The two key variables, as mentioned above, are the position in the data graph and the saturation, or level, of colour at that point. Through a process of approximating the data (using a ‘sort’ function) this creates a number of 11 groupings, called saturation blocs. Each saturation bloc spans 20 units of saturation (1–20, 21–40 etc.), and this creates a new representation of the data as follows:

Therefore, at any point in the piece, there will be a ‘position’ value as well as a ‘saturation bloc’ value. These saturation blocs determine the rate at which the harmony moves in the piece (the harmonic rhythm) at any given moment: the higher the saturation bloc, the quicker the harmony moves. For example, in the top graph above, where position=100 and saturation=131 this results in an approximation to saturation bloc 6 in the lower graph. Thus, a hierarchical system is set up to control harmonic rhythm. The full details are not within the scope of this introduction.
The harmony and pitch of the piece is generated through treating the filtered colours (R/G/B) as three four–note cells which contain all 12–notes of the chromatic scale (generated through a random number generator to reduce bias),(5) whilst RGB is the combination of these cells (known as the aggregate). To expand the amount of material, I then transposed each set onto itself to give a total of four four–note sets as well as a nine–note aggregate set. This process aligns with the idea of ‘saturation’ in the context of the data as a representation of colour–levels. The final pitch material of RGB is shown below:
The roman numerals under each group hold a connection to a particular saturation bloc. Blocs 1 and 2 use I, 3 and 4 use II, and so on. Group V spans blocs 9–11. The groups exist mostly in two arrangements: ordered (a) and unordered (b), although a third, retrograde (backwards) (z) exists for saturation bloc 11.
An important point to emphasise is that synesthetic notions of musical colour (e.g. those of the composers Scriabin and Messiaen) (6) are not used in this study; one should see R/G/B as abstract combinatorial variables rather than holding phenomenological meaning. (7)
The usefulness of creating these structures is that the compositional process becomes strictly controlled yet allows for personal intuition. The saturation blocs, which control the speed of harmonic movement, create situations in which certain harmonic/pitch elements must occur, but the way in which they occur is left totally free. Elements such as tessitura, dynamics, and rhythm are at the discretion of the composer. It would be interesting to try to incorporate these non–pitch elements in future experiments, however.
Examples
The beginning of the piece is calm, mysterious, and reflective. Both graphs R (piano) and RGB (clarinet) are at a low level of saturation (mostly saturation bloc 1), and thus everything moves slowly. The numbers in square brackets represent the position on the filtered graph, whilst the roman numerals dictate both the harmonic group and whether the cells are played in order or not. Note how the piano plays only R material, whilst the clarinet plays all three colours, RGB.
The highest level of colour saturation is found in the R graph, in which saturation bloc 11 is used. However, the clarinet is still playing comparatively long notes. That is because the position on the two different graphs generate different saturation blocs, and thus different levels of harmonic rhythm. Bars 43 and 44 are shown below, with their corresponding positions in the data graphs.

Sonfiying the data graphs also creates interesting and definitive structural moments. For example, each filtered graph (R, G, B) ends with a zero reading of colour saturation for several points. However, due to the dual structure shown above, the clarinet’s RGB graph gives a saturation reading above zero. This creates clarinet ‘solos’ that bridge the space from the end of one filtered graph to the next; creating the impression of structural ‘movements’ as shown below:

Whilst not exhaustive in any sense, this article has attempted to give an introduction to how data sonification can be used in contemporary classical composition. RGB (2019) is an example of the possibilities that can arise when combining data sonification with 12–tone composition. I think it provides an effective balance between formalism and intuition that allows the composer to engage with both musical and computational considerations. Through experimentation with both the musical inputs (the R/G/B cells etc.), and the computational inputs (choice of image, heterogeneity of data sets), it is hoped that a rich variety of musical structures and materials will be uncovered, thus allowing for a truly expressive amalgamation of the formal and the poetic on both surface and structural levels.
1. http://mkweb.bcgsc.ca/color–summarizer/?analyze
2. The reason for this being that in 2017, I composed a piece for piano duet that used the visual, immediate, shapes of the painting as a compositional tool (see Out of the Web: Approximation on my website).
3. C. Scaletti in D. Worrall, ‘Introduction to Data Sonification’, in R. T. Dean (ed.), The Oxford Handbook of Computer Music, OUP, 2011, p. 312–313.
4. The data tables that form the graphs can be viewed here: https://www.dropbox.com/s/230o9t70s57fj15/Appendix%201%20–%20RGB%20colour%20data.xlsx?dl=0
5. Duplicate random numbers were disregarded. C was taken as ‘1’, increasing in semitones for each number up to ‘12’.
6. See Scriabin’s Clavier à lumières (1915) and Messiaen’s Couleurs de la Cité celeste (1963).
7. For more on this idea of scientific/synesthetic discourse, see Christopher Cox, Sonic Flux: Sound, Art, and Metaphysics, Chicago, University of Chicago Press, 2018, Ch. 6.

Bio: Thomas Metcalf (b. 1996) is a composer and researcher studying for a DPhil (PhD) at Oxford University. His work focuses on the transformation of graphical spaces into determinate musical ones.


